
Apple Search Ads: What’s my true ROAS?
Welcome to MAMA Boards, a brand new AppsFlyer video project featuring leading mobile marketing experts on camera! The MAMA Boards are 10-15 minute whiteboard-style, mini master classes.
We recognized that many marketers face challenges in the mobile landscape (like measuring true Apple Search Ads ROAS) and wanted to bring you professional tips and advice on-demand to help you overcome these challenges and excel at your job.
Ready to become an Apple Search Ads rockstar?
We are thrilled to present our very first MAMA Board video, featuring Thomas Petit of 8fit, to cover Apple Search Ads best practices for measuring and maximizing your true ROAS from this powerful channel.
This can be less straightforward than with other media sources, especially with a larger than normal discrepancy between Apple’s reporting and your measurement partner. Get ready to become an Apple Search Ads Rockstar!
Real experts, real growth. That’s our motto.
Note: A re-download in AppsFlyer is based on a re-attribution window that is configured by the advertiser, and not the lifetime window as defined by Apple. Enabling re-attribution in the AppsFlyer dashboard will reduce the re-download discrepancy mentioned in the video.
Transcription
Hi, everyone, and welcome to another edition of MAMA Boards by AppsFlyer.
I am Thomas from 8fit, a fitness and nutrition app that I have seen grow from pretty much zero to over 20 million downloads now. And today we’re going to talk about one of my favorite topics, which is Apple Search Ads, and how to measure my return on investment from it, which is a little bit trickier than on other channels. So, let’s get into it.
First thing we’re talking about is Apple Search Ads. For those who don’t know it, this is prime placement within the App Store. This is the very first time you can actually buy some advertising within the Apple Store, which is an unparalleled user acquisition source because of both placement and also because of the insights that you can get from it and actually use for your App Store optimization.
That’s one of the reasons this is one of my favorite topics.
What is Return on Ad Spend (ROAS) and what are the main challenges of measuring it in Apple Search Ads?
Today we’re going to try to determine the return on that spending we’re getting from it, so I want to take a little break here and define what is return on ad spend.
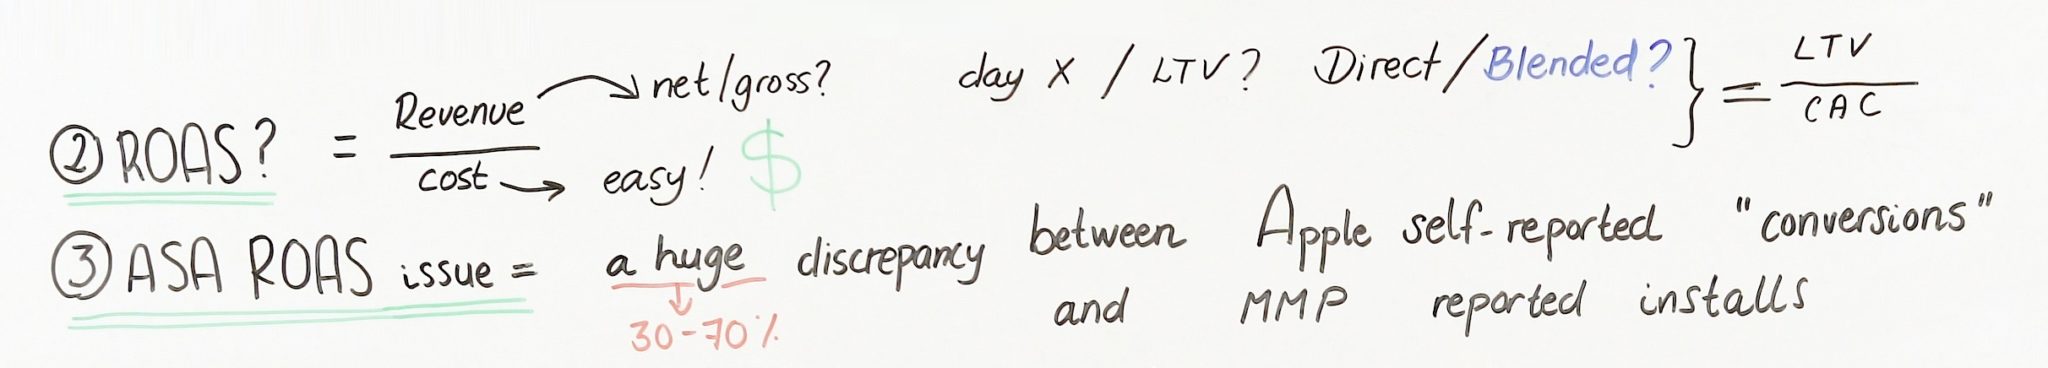
Of course, it’s revenue divided by cost – pretty much everybody knows that. The thing is, one company to another might have little differences in how they measure the revenue.
Are they counting the net revenue or the gross revenue? Are they counting the lifetime value or are they stopping the revenue at day seven or 30? Are they measuring only the direct effect of what they can analyze or are they blending the organics into it, which we will detail a little bit later. And an important thing is, “Are they actually counting the brand terms campaign within the channel?”
Those are actually a bit different from the acquisition you can do normally, those users would probably would have come to your app anyway, so every company makes its own decision. I don’t think there is a good and bad choice to define it one way or another – just make sure you’re defining it the same on all different channels.
This is actually not what we are going to debate today, how to define the return on ad spend.
We are going to deep dive a little bit into a bigger issue: compared to other channels, it is tricky to measure the return on ad spend in Apple Search Ads.
The reason for that is that it’s pretty traditional to see little difference between what the network is going to self-report it sees and what your MMP is going to report to you. Probably these differences are around 5%, 10%, maybe, so it’s common and we’re all used to dealing with the problem.
But here on this particular channel, the difference is absolutely huge. We’re talking about 30% to 70% discrepancy! How do I know my real return when the difference is so big?
One source here is what Apple is telling you in the interface where you actually grab the cost, while the other one is what’s coming to your MMP.
We are going to deep dive a little bit into why these differences exist before we define how the return on ad spend is calculated and how I would recommend you to calculate it.
Potential discrepancies
There are many layers and many reasons why these discrepancies exist.
1. Methodology
We start from the Apple number of installs, let’s say it’s 100, and the first thing to know is that the methodology that Apple uses is a little bit different from the one your MMP is going to use.
The MMP is going to measure when the app is actually opened for the first time, whereas Apple sees the whole funnel – the very top of the funnel where people initiate the download – and maybe the connection breaks or they install the app and they never open it.
That can happen.
It’s actually a fairly small difference, maybe up to 5% – I don’t really know the exact number because nobody other than Apple knows that one, but it’s fairly small, so let’s move on.
2. Self-reporting vs. de-duplicating
The second reason is that Apple only sees the Apple installs you’re receiving from search ads, while your MMP is seeing a lot of different signals from many channels.
It’s very likely that some users are impacted by several different networks, several different ads. Which one of them is really the one that needs to be attributed? That’s actually why you’re mostly paying the MMP to complete this work of de-duplicating and understanding which channel should be attributed for a particular install.
So, you need a view of all the networks to do that, which only the MMP has. I personally believe that de-duplication is not a huge discrepancy in this matter, nor is it the main factor for the big difference we mentioned earlier. So, let’s say 5 to 10% difference, although the truth is that I really don’t know this exact number either.
3. Attribution window
Then we’ve got the attribution window. You can set it up a bit differently – I like to use seven days post-click myself, but that’s another big debate in the attribution world.
In their case, Apple measures up to thirty days post-click, which might create a little bit of difference between what they report and what the MMP reports. There’s no single source of truth here, just different ways of seeing things, but it does means that Apple and your MMP are going to report a little differently.
How big is this difference, I don’t know either. You’re going to tell me I don’t know a lot.
There have been three statistics I didn’t know exactly, but the reason I don’t insist here is not because I don’t know, but because they have been fairly small. Now we go to the big ones.
4. Re-downloads
There are three very big reasons that make the discrepancy you see.
The first one is re-downloads – people who install the app not only for the first time, but for the second, maybe third time. I put that this amount is about 26% of the difference between Apple and the MMP
Note: A re-install in AppsFlyer is based on a re-attribution window that is configured by the advertiser, and not the lifetime window as defined by Apple. Enabling re-attribution in the AppsFlyer dashboard will reduce the re-install discrepancy mentioned in the video.
5. LAT – Limit Ad Tracking
The next one is LAT, the Limit Ad Tracking option.
Apple provides users with the option to actually exclude themselves from being measured, which, from a privacy standpoint and as a consumer, I think is great. I’m using it. So, whenever somebody would activate this Limit Ad Tracking option, the IDFA, or the identification number that is associated to that device, is substituted with zeroes.
What happens is that Apple, to protect the privacy of its user, decides not to pass user level information to the MMP, which is completely normal. This difference can amount to 15 to 20%. I have put 18% here and you’re going to know exactly why in a second.
6. API glitch
And we are getting to the last reason for the discrepancy, which I wrote here is the API glitch.
There used to be, at the very beginning of search ads, a little bit of a glitch in the API – they didn’t pay enough servers. They have just started it, I don’t know if it is better, but I hope this is solved by now. It’s not exactly a glitch – it’s the fact that, if there is a long time between the moment the user actually installs the app and opens it, or the opposite – if he does it extremely fast – the server might miss some of the installs.
I personally believe that this is also a very very small amount – maybe 2, 3% – but here I wrote 8%. The reason for this is that, last year, the VP of Apple, Todd Teresi, actually disclosed the numbers that they see across the board to explain to everyone why this discrepancy exists. These are the values that he shared publicly.
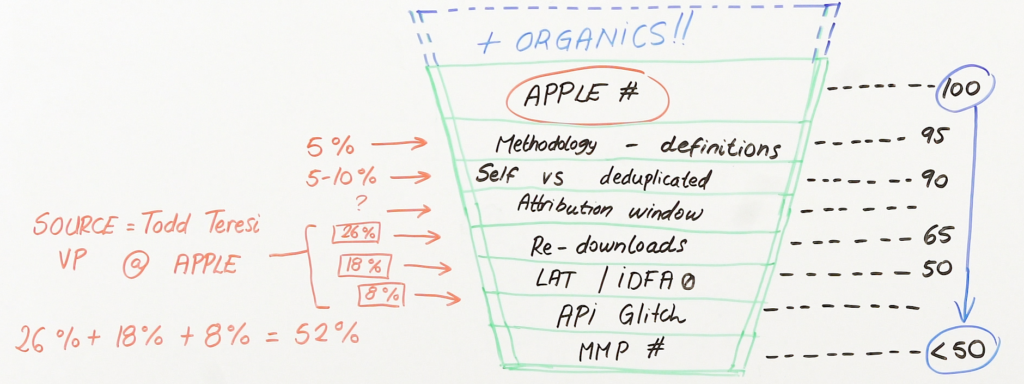
If we add the 26% of re-downloads and the 18% of LAT users to the 8% of this API difference, this amounts to about 52% of difference. And that explains, more or less, why our range is between the 30 to 70% of discrepancy that I mentioned before – it’s just right in the middle.
The thing is, those numbers are going to change a little bit between apps. Averages are a bit tricky – they’re good values to understand where the difference is but you’re going to want to check what yours are exactly. When we multiply all of this, you will see 100 installs reported on the Apple dashboard. Every one of these layers multiply up to the point that you only receive less than 50 installs on your side.
On average, it’s probably closer to 48. I wrote 50 on the board to make the following calculations a little bit simpler.
So how exactly can I calculate my true Apple Search Ads ROAS accurately?
So, let’s get back to the first point, which was, “What is my return on ad spend?”
How much money is coming back to me when I’m spending money on this acquisition channel? And the strictest way of calculating it is only counting the revenue that I can see through my MMP. This is because the rest of it is actually unknown. I’m guesstimating that what’s coming here is not the exact value that I’m seeing.
And that’s what I see most of the time. I want to see what I’m certain about first and then I’ll share what I think [a more approximate guess] might be. But let’s first get to the value we’re sure of.
1. “Stricter” ROAS Calculation
In this “strict” method, I’m going to take the revenue from the install that I get from an MMP and divide by the cost that Apple sees. I made a little example here: a random app, let’s say it’s a game, that monetizes pretty decently managed to make $5 for every install.
I like to write ARPi here instead of the classic ARPU value because my install-to-sign-up is a little bit of a different.
Since not everybody signs up, I rated this way, but usually, people in the industry would mention ARPU.
Let’s say I’m pretty good at my search ads campaign and I’m only going to pay two dollars per install, which in the US is a fairly decent price, in my opinion.
If we do a little math here, we can take the 50 installs that my MMP has reported to me multiplied by the $5, and divide this by the $100 that Apple is seeing and the $2 that I am paying. What we get here is actually a profit of 25% on this ad spend. I put $100 in the mix and I’m getting $125 back. Well, that’s positive, so at least that’s some [profit], but that’s the strictest ROAS [calculation]. I’m just counting these 50 installs you’ve seen at the very bottom.
2. “Extended” ROAS calculation
So, let’s get to the second part of the board, the most interesting, in my opinion. We’re going to try to measure what’s actually invisible to your MMP. Before I get to my own method, you could decide to make it simpler and actually report on 100% of the installs that Apple is showing you in its interface. I would call that the extended ROAS, for which I have the formula here.
In this scenario, we’re taking all of the 100 installs here and if we’re doing a little math with the same example, same assumptions, what we’re seeing is that I’m actually making 150% positive return, which is six times more than what I was making before. I don’t particularly like to use this method – not that these install don’t exist – but you might be counting them elsewhere already. Maybe they’re hidden in your organics, maybe they’re hidden in another network. If you start double counting them, you have to bring revenue to several people, even though this is actually the same revenue.
So, we’re going to try the way I estimate my ROAS.
Let’s say we have an in-between case, or between 50 and 100 installs. Of all the discrepancy we’ve seen previously, all these layers, which ones will I consider and which won’t I? I usually don’t factor in the first one; one of the reasons is because it’s very hard to measure them. The second is, as I mentioned, the smaller differences. I think we can actually forget about them. But we can’t really forget about the three big ones.
So let’s take my case. I don’t want to use these averages, even if they’re true. I want to know what’s actually [beneficial] for my app. So I take the 50 installs from my MMP and then I’m going to try to look at how many people activated the LAT option.
Maybe you’re [calculating] for a VPN app, where there are many users who are concerned about privacy – this is going to be around 50% [activation]. Maybe you’re working for an audience that is not very tech savvy, for which LAT would be very low, but it’s been only very recently that Apple is telling you the percentage in its interface. You need to activate a hidden column and then you will see both LAT conversion and LAT-off conversion appear.
So, you can calculate your own percentage. In my case, it was fairly high, about 20%, so that’s the number I’m going to use – but don’t take my number, go check yours.
The second big discrepancy – the 26% we mentioned before, and that’s only since this week – this is very new. You can also access them in the interface. You will also have to edit the column and then unhide this information. In my case, it was way below the average – I was just at 10%. Why do less people re-download my app? There’s a lot of hypothesis in there, but let’s get back to how I’m calculating.
You notice that, here, I wrote an extra 5% in blue, which is the color we used before for the blended organics.
There are a number of reasons that some extra organics are coming in with the [paid installs]. One of the reasons, explained by AppTweak, is that Apple is giving you a free placement in the organic listings when we pay for an ad.
Since it’s only at position eight or nine, it’s fairly low and I imagine that not a lot of people are going to click on that app. But those ones are not even reported by Apple, they just come on top of the rest of the cake.
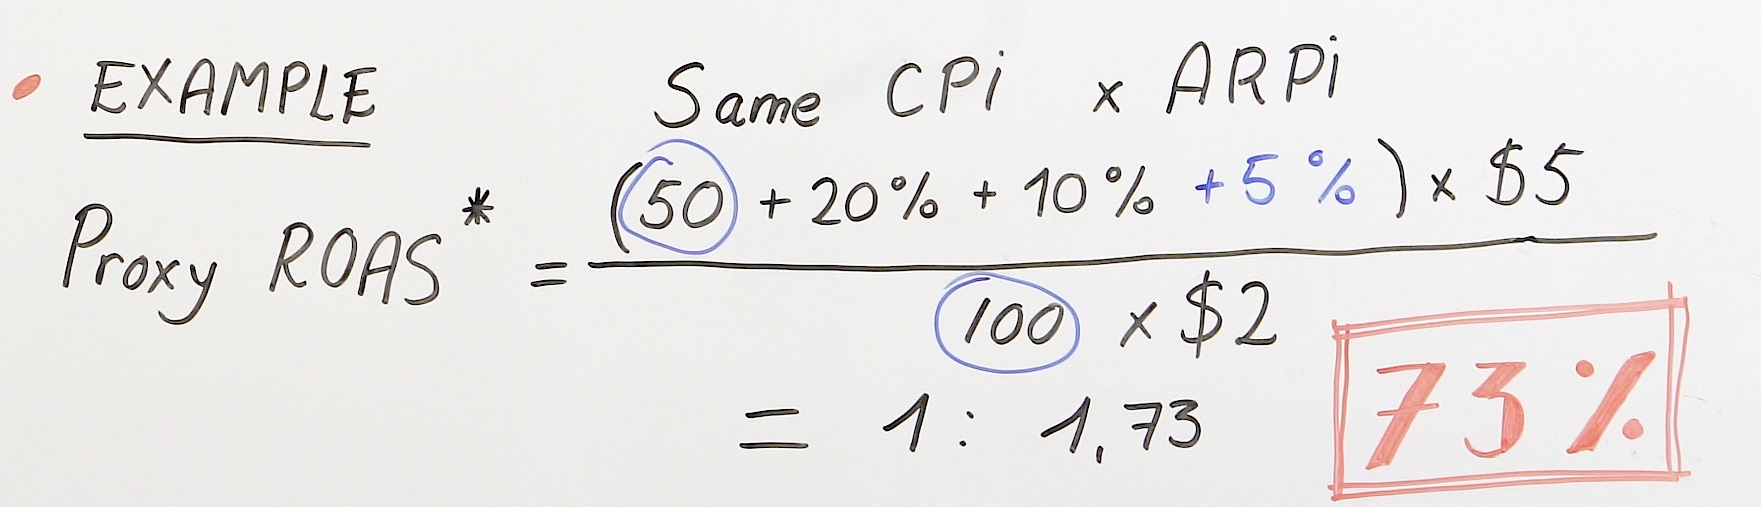
I’m going to say that, between all this difference, I’m not factoring in these extra organic installs. I’m going to add a little 5% extra, it makes it look better on my board because my return is better. And I’m going to add all these differences, that are true, from my app. So let’s get to the final calculation today.
This proxy ROAS, which I believe is the closest to the real one, is taking the 50 installs I’m seeing in my MMP dashboard plus 20%, plus 10%, plus 5% on top of all of that, which I then multiply by my revenue per user, by my $5. I divide by the same cost as usual and what I’m getting here is 73% positive return.
Get the latest marketing news and expert insights delivered to your inbox
Putting it all into practice
Let’s look back at the first [ROAS we calculated] that was 25% return.
With this methodology that I explained, you’re making the same amount of money, but what you see and what you report to your colleagues, to your board, and what you think you’re actually making from your investment in the user acquisition channel, is actually three times higher – that’s a pretty big discrepancy.
What I invite you to do is actually to not take my numbers, but define by yourself the number that you see in your interface – what you believe is true for your own app, whether it’s from the Limit Ad Tracking users, the re-downloads, or this extra 5% that I’m adding.
Make your own choice, determine [your own numbers] with the same methodology and formula, and report the true ROAS for your app, what you believe it is.
That’s it for today!
I would be very interested to know how you are calculating your ROAS, how you are defining these numbers, what differences you see from the strict calculation, so feel free to write that in the comments. You can also mention the video online and we will have a fun chat about it. I invite you to also watch the other MAMA Board videos.
If you visit that URL, you’re going to see the other episodes of MAMA Boards.
That’s it for today, thank you very much everyone.
Bye-bye.